Yes — the low is in the $54,000–$64,000 box. Bitcoin closed 30 June at $58,566 and spent the summer there. On 20 August it smashed through a stack of bear-market resistances into the $70,000s. That is the start of a soft bull, not the all-clear. $71,500 is being tested. $78,000 and $82,000 still have to flip. The Bitcoin 500-day cycle buy date does not move: December 4, 2026. Not financial advice.
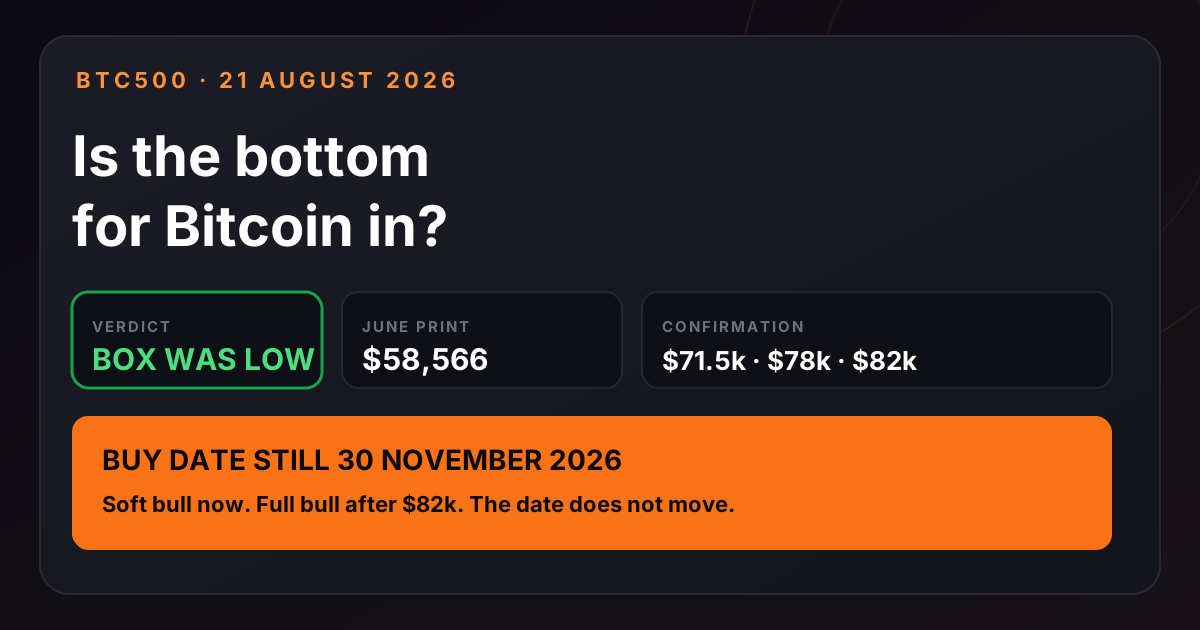
Verdict, 21 August 2026: the summer base between $54,000 and $64,000 was the cycle low. The ladder from here is $71,500, then $78,000, then $82,000. We are in a soft bull — the transition, not the trophy. A weekly hold above $71,500 is the next proof. $78,000 and $82,000 still have to flip before the bull is fully confirmed. Past performance does not guarantee future results.
The tape on 21 August 2026
Bitcoin set its record at $126,198 on October 6, 2025. It then spent ten months grinding lower. The closing low of this drawdown is $58,566 on 30 June 2026 — inside the $54k–$64k accumulation box. VanEck's 18 August ChainCheck treats that June print near $58,500 as a potential trough. Price then spent July and early August in a tight band around the low-$60,000s, which is the top of the same box.
On 19 August Bitcoin tagged about $69,700 after the U.S. Treasury doubled long-end buybacks and roughly $1.1–$1.4 billion of shorts were liquidated. CoinMarketCap shows a 20 August close of $73,033. Cointelegraph reported more than $3 billion of crypto short liquidations as Bitcoin neared $72,000. That two-day candle walked through the resistances that had capped the entire summer.
| Snapshot | Figure |
|---|---|
| All-time high | $126,198 · October 6, 2025 |
| Closing low so far | $58,566 · 30 June 2026 (−53.6% from ATH) · inside the $54k–$64k box |
| 19 August session high | ~$69,700 (CoinDesk / Bitcoin.com) |
| 20 August close | $73,033 (CoinMarketCap) |
| Live BTC500 spot | Live price loading… |
| BTC500 buy date | December 4, 2026 · 77 days |
The map: box, then three flips
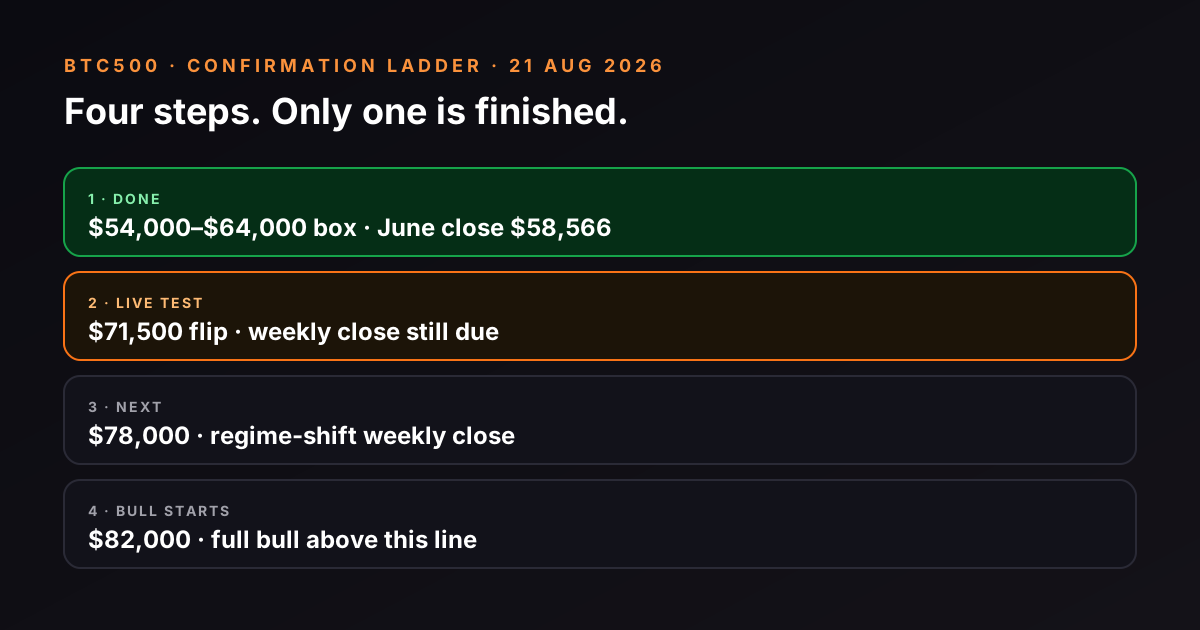
The structure is a box and three doors. The box is roughly $54,000–$64,000 — the summer base, and the buying area through July. Above it, the weekly candle of 19–20 August punched through about $64,500, $68,000, and $71,800 in one go. Next come $78,000 and then $82,000. Until $82,000 flips, this is a soft bull, not a finished regime change.
That is a structure call, not a new price target. The low is in. Two or three doors still have to open before the bull is fully confirmed.
The box is the part that already happened. The June close of $58,566 sits inside it. July and early August never left it. The people who waited for $40,000–$50,000 — Galaxy's Q4 base, the 77% washout template, the “30% below the 200-week” analog — were waiting for a wick the market did not deliver. That is the consensus bottom trap in real time: the crowded map was $40k–$50k in September. The print was $58,566 in June.
The confirmation ladder
A flip here means trade significantly above the level, or post a weekly close above it. Tagging a number mid-week after a liquidation cascade is the first half of that test. The week still has to close.
| Level | Role | Status · 21 August |
|---|---|---|
| $54,000–$64,000 box | The low. Summer base. June close inside it. | Done. $58,566 is the print. |
| $71,500 | First flip. Daily 200 EMA sat near $71,700 on 20 August. | Live test — weekly close still due |
| $78,000 | Regime-shift close. 21Shares wanted this area on a weekly basis back in June. Glassnode's True Market Mean was ~$75,800 on 19 August. | Not yet. |
| $82,000 | Full bull above this line. | Not yet. |
Soft bull means transition, not trophy. Saying the bear is over and that $78,000 and $82,000 still have to flip is the same sentence: the low is in, the bull is not fully confirmed. That is the honest read of the chart. Live spot on this page is loading.
Why this week counts
The last 72 hours are the event that moved the structure. We already wrote the 19 August tape: Treasury long-end buybacks, a $1.4 billion short squeeze, ETF inflows, a White House crypto meeting. SoSoValue figures for 19 August show U.S. spot Bitcoin ETFs taking in about $517 million that day and about $1.21 billion over 30 days. Cointelegraph then printed more than $3 billion of short liquidations as price neared $72,000.
Forced covering is not a cycle by itself. It is how a boxed-in market leaves the box. The 200-day moving average that VanEck had near $69,884 on 12 August — when spot was still 9% below it — has been reclaimed. As of 20 August the 50-day SMA sat at $63,976 and the 200-day at $69,005, with Bitcoin trading above both. That is the golden-cross setup. It is not the golden cross until it prints and holds.
Independent on-chain maps rhyme with the same ladder. CryptoGoos's rule is the clean version: two weekly closes above short-term-holder realized price confirm a new bull; a single breakout that fails is the 2018 analog. Captain Altcoin noted Bitcoin had already broken above that short-term-holder cost basis during this move. One weekly close is a start. Two are the regime.
Elite wallets were already accumulating inside the box — 90 addresses holding 10,000+ BTC hit a six-month high on 11 August. CryptoQuant via Bloomberg showed wallets excluding exchanges and miners adding about 43,000 BTC over 60 days. The strongest hands bought the box. The squeeze is what forced everyone else to notice.
What this does not erase
A shallower trough was the live assumption before this week. VanEck fired 8 of 12 capitulation signals as of 12 August and said this cycle should not copy 2022 because there has been no Celsius, no Three Arrows, and no FTX. They still placed the historical transition in September through November. The box says the low already printed inside that window's left edge.
The BTC500 bear-market composite still does not look like 2018 or 2022. Mid-August snapshot: MVRV 1.22 (historical bottoms were under 1.0), NUPL still positive, Puell 0.74 (not miner capitulation), drawdown about 40% at live spot versus 77–85% at prior troughs. RHODL and Reserve Risk were already in the green band. Read that as this cycle being shallower — the VanEck point — not as a reason to wait for $29,000. Primary on-chain flushes are a 2018/2022 template. This week is a structure break, not a 77% replica.
Galaxy's $40,000–$46,000 Q4 base, Cowen's late September, Brandt's ~4 October, and CryptoQuant's September–November cluster are still the crowded desk view. They are the map of people who need another leg down. If the box was the low, that wick does not arrive. The calendar is not useless: it is when they expected the low. It is also when BTC500 buys.
Invalidation is on the same chart
A thesis without a kill switch is a slogan. The kill switch is the box.
- Weekly close back inside $54,000–$64,000, especially below $64,500, turns this candle into a bear-market rally. Soft bull on pause.
- Weekly close below the 30 June print of $58,566 ends “the bottom is in.” Then the Q4 camp gets its second chance.
- Rejection at $78,000 without a weekly hold above $71,500 is a failed flip, not a new bear by itself. It puts the squeeze back in the “weather” column until the next weekly close.
- Jackson Hole is 27–29 August. A mid-week squeeze does not pre-clear a Fed weekend. The weekly close after that symposium is the first real $71,500 test.
You still do not need the exact wick
Buyers who sat in the $54k–$64k box through July already have the low. Four-year-cycle buyers marked September and October and are still waiting. BTC500 does neither. The rule is one line, and it does not move because a two-day candle was violent:
BTC500
Buy 500 days before the halving
Sell 500 days after
Official buy date: December 4, 2026 · 77 days
If the box was the low, December 4, 2026 is still early-bull. If $78,000 rejects and the box breaks, the date is still the date. Past performance does not guarantee future results. Educational software, not financial advice.
That is the point of a calendar. Structure can be right and you can still be early, late, or emotional. The simulator runs the windows against real prices. The bear-market page is the live composite. The homepage cycle score rolls price path, drawdown, phase, and on-chain heat into one number so you do not have to relitigate every candle.
What to watch next
- This week's close versus $71,500. Trade through it is not enough. The weekly close is.
- A weekly hold, then $78,000. That is the 21Shares regime-shift line and the next door on the ladder.
- $82,000. Full bull above this line. Until then it is a soft bull.
- Spot follow-through after the shorts are gone. ETF prints that stay bid. Forced covering is one-and-done.
- The box. Lose it on a weekly close and this page's verdict is wrong.
- The date. Nothing here moves December 4, 2026.
Sources for the 21 August tape
Structure: weekly BTCUSDT map — $54k–$64k summer box, then $71,500 / $78,000 / $82,000. Price: Forbes Advisor, 20 August 2026 (ATH $126,198 on 6 October 2025); 24/7 Wall St., 10 August 2026 (30 June close $58,566); CoinMarketCap 20 August close $73,033; Cointelegraph, 20 August (short liquidations past $3 billion). On-chain and cycle: VanEck Mid-August 2026 Bitcoin ChainCheck (Matthew Sigel, 18 August); Glassnode True Market Mean ~$75,800 and short-term holder cost basis ~$68,500 as of 19 August; BTC500 BitView composite. Flows: SoSoValue 19 August ETF dashboard. Macro: Federal Reserve Bank of Kansas City, Jackson Hole 27–29 August 2026. Prior BTC500 notes: Why Bitcoin Pumped, week of 17–23 August. Bitcoin crossed $80,000 on 27 August — the breakout read and the hold-the-line levels. Figures can be revised as exchanges and funds publish finals.
FAQ
Is the bottom for Bitcoin in as of 21 August 2026?
Yes — in the $54,000–$64,000 box. The closing low is $58,566 on 30 June 2026. Bitcoin is in a soft-bull transition after smashing through summer resistances on 19–20 August. Full confirmation is a weekly hold above $71,500, then $78,000, then $82,000. The BTC500 buy date remains 30 November 2026.
What was the Bitcoin low in 2026?
The lowest closing print in this drawdown is $58,566 on 30 June 2026, about 54% below the 6 October 2025 record of $126,198. That print sits inside the $54,000–$64,000 accumulation box. VanEck describes a potential trough near $58,500 on the same date.
What levels confirm the Bitcoin bull market?
Three flips, in order: $71,500 (trade significantly above it or a weekly close above it), $78,000 (same rule; the regime-shift close), and $82,000 (full bull above this line). Until $82,000 flips, call it a soft bull.
What would invalidate this Bitcoin bottom call?
A weekly close back inside the $54,000–$64,000 box, especially below $64,500, pauses the soft-bull read. A weekly close below the 30 June print of $58,566 ends “the bottom is in.” Rejection at $78,000 without a weekly hold above $71,500 is a failed flip, not automatically a new bear.
Does this change the BTC500 buy date?
No. The official buy date remains December 4, 2026 — 500 days before the projected April 2028 halving. If the box was the low, that date is still early-bull. If the box breaks, the date is still the date. Past performance does not guarantee future results.
What is the BTC500 strategy?
Buy Bitcoin exactly 500 days before each halving, hold through the event, and sell exactly 500 days after. No indicators, no day trading — one fixed rule tracked publicly against historical cycle data. Not financial advice.